- Advertising
Page-Level Reporting: Taking Your Data to Another Level
•
By now it’s no secret. The Mediavine Dashboard has been undergoing an extensive renovation behind the scenes, and one of the most exciting components of this much-anticipated relaunch is page-level reporting.
What is Page-Level Reporting?
Think about how amazing it would be to see data-driven reports on not only your website’s performance as a whole, but your top pages to see how they’re performing on an individual URL basis.
Many of you already thought about this in fact, and have asked us for this feature for years. Now it’s finally here, and as you’ll learn from your page-level reporting, the results are eye-opening.
Each blog post, homepage, landing page, etc., on a given website will see differences in ad performance, so the ability to easily note this variance and use the data to your advantage is pretty exciting.
That’s right, eye-opening and exciting! Can you tell we’re happy with this? With access to this data, there’s so much to learn in terms of which blog posts to optimize, what to promote and beyond.
Traditional Mediavine Dashboard reporting has always been helpful, but this takes it to another level entirely. We’re thrilled to finally announce it and help publishers experience it for themselves.
How Does Page-Level Reporting Work?
We use Google Analytics, which you provide us access to within the Mediavine Dashboard, to track your most popular 100 pages per day.
When a visitor reaches your top pages, we track their performance in our ad server, Google Ad Manager, via what are called “key values.”
Given that key values are limited, both in terms of length (40 characters) and the total number you can report on, we had to get creative.
Our engineering team ended up building our own URL translation system as part of this process, but that’s a topic for another time.
Just know we had to build an inventive and robust system — parsing billions of page requests per month and translating them to a limited number of shortened key values — to pull this off.
TL;DR — Engineers, gotta love them.
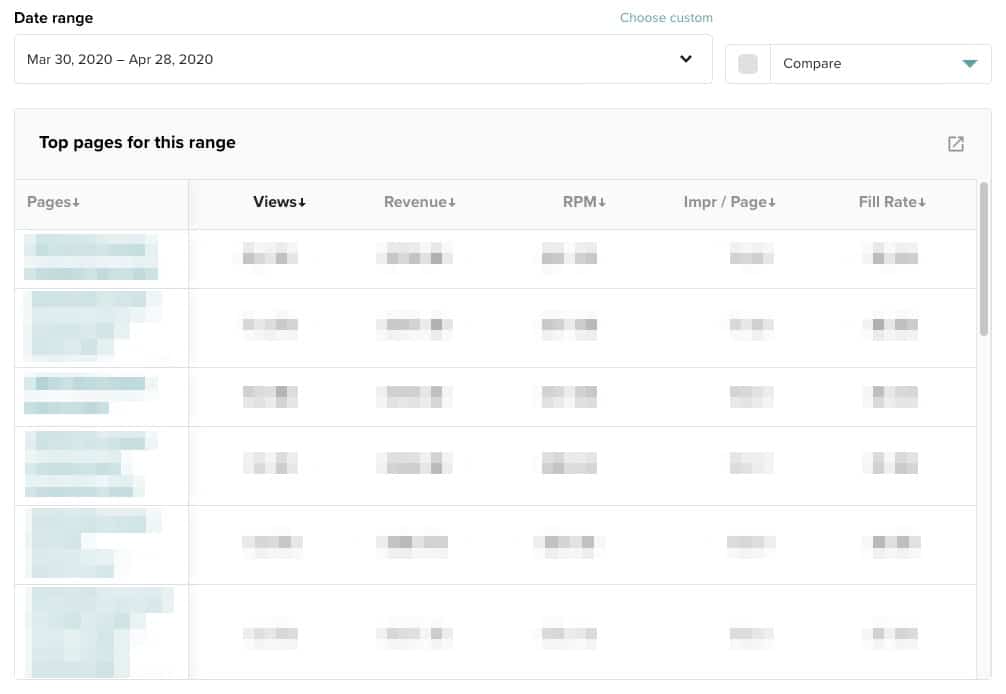
What Metrics are Available?
For each URL, you’ll be able to see the number of views (according to Google Analytics), approximate revenue, RPM, CPM, Fill Rate, Viewability and average Impressions / Page.
Yes, that is a lot of data.
In a future blog post, we’ll go over tips and tricks on how to use these numbers to help you improve your RPM. For now, here’s a brief overview of what they mean and how to improve them:
- RPM — Many of you know what RPM is, but one more time for those in the back: It’s the revenue you earn, on average, for every thousand views of that page. This varies, from page to page, due to all the factors below. As a result, you can look at RPM as a “summary” metric, but not one that provides much actual insight — the rest of these all influence that summary.
- Viewability — What percentage of the ads on this page were seen on average. Ultimately, advertisers pay only for ads that are seen, so you can use these metrics to figure out which pages are helping or hurting you. Common causes of poor ad viewability include low user engagement with content around your ads, certain traffic sources or slow pagespeed.
- Fill Rate / CPM — These factors are intertwined, and useful to look at together. While fill rate is the percentage of paying ads vs. total ad requests on a given page, CPM is the amount your ads earned on this page, on average, per one thousand impressions. Looking at these two factors together will help you identify pages that are earning you less per ad impression. Why are they earning you less or more? Common reasons include the keywords used in your posts, demographics of users reading them, countries they’re browsing from, device types and traffic sources.
- Impressions / Page — Note that this is NOT the number of ad units on a page, but the number of impressions served. That includes counting an ad multiple times as it refreshes on the page. If it seems high, that’s actually a good thing. A VERY good thing. If it’s too low, it’s a bad thing. This is probably the most useful metric of the entire report because you’ll have the most control over it. If the number is too low, it’s time to optimize your content. Improve your impressions per page — and subsequently your RPM — by writing shorter sentences and paragraphs, using more images, increasing font size and every other content tip we’ve ever given you.
Again, more to come on all of this!

How Accurate is This Reporting?
If you’re looking at a single day and comparing values between pages, it’s pretty darn accurate. More than accurate enough to make a big difference and to feel confident about impactful decisions.
However, if you’re looking at lifetime earnings for a URL, or using this data for accounting purposes, then it’s not accurate enough due to the limitations of the system.
First, we’re only looking at your top 100 pages each day. If a page falls out of your top 100, it won’t be tracked for that day.
A hundred pages is a lot, but over a longer period of time, the pages floating in and out of the top 100 will vary, and as a result, the numbers displayed may not equal the lifetime total.
You can read more about this phenomenon in our help guide on page-level data.
However, for the purposes described above, this isn’t an issue. Better yet, because we only pull revenue for top pages, relative revenue metrics such as RPM, viewability, CPM and fill rate will still be accurate over the ranges you select.
The second factor that could impact the accuracy of the reporting is Google Analytics. Any filters, changes or alterations you make to your Google Analytics settings can impact the data you see in the dashboard.
How Can You Access Page-Level Data?
If you’re reading this while Dashboard 2.0 is in beta testing, just head on over to the beta URL in the banner at the top of your regular dashboard. It’s an open beta every Mediavine publisher has access to.
However, in the future, when Dashboard 2.0 rolls out to become just the Dashboard, you’ll just scroll down to the page-level section. As long as we have Google Analytics access, you get this feature for free!
About the author
Share this page